A Custom ggplot2 Theme for Facebook
Update 04-02-2017: See the awesome package
ggtech for a Facebook theme and many others.
Why?
I thought it would be fun to create a Facebook theme for ggplot2 after seeing
this (kind of old) article where Facebook data analysts have clearly used
ggplot2 to make their graphs. I
tweeted about it and because I’m “on winter break” right now and I just revamped my website, I decided to create this blog post about it.
I use the
ggplot2 themes vignette and the package
ggthemes as references when creating this Facebook theme.
The Theme
library(ggplot2)

# facebook colors
# from https://designpieces.com/2012/12/facebook-colour-palette/
# and darkblue from http://www.color-hex.com/color/3b5998
fb_colors <- c(blue = "#3b5998", medblue = "#6d84b4",
               lightblue = "#afbdd4", lightestblue = "#d8dfea",
               white = "#ffffff", darkblue = "#111a2d")

# facebook color palette (see ggthemes)
fb_pal <- function () {
  function(n) {
    colors <- fb_colors[rev(c("darkblue", "blue", "lightblue"))]
    unname(colors[seq_len(n)])
  }
}

# discrete scale colors for facebook
scale_colour_fb <- function (...) {
    discrete_scale("colour", "fb", fb_pal(),
                   ...)
  }
scale_color_fb <- scale_colour_fb


theme_fb <- function(base_size = 11, base_family = "Lucida Grande",
                     fbcolors = fb_colors){
  half_line <- base_size/2
  theme_bw() %+replace%
    theme(text = element_text(family = base_family, face = "plain",
                              color = fbcolors["medblue"], size = base_size,
                              hjust = .5, vjust = .5, angle = 0, lineheight = 1.1,
                              margin = margin(), debug = FALSE ),
          panel.grid.major = element_line(colour = fb_colors["lightestblue"]),
          panel.grid.minor = element_line(colour = fb_colors["lightestblue"],
                                          size = .25),
          plot.title = element_text(size = rel(1.2), hjust = 0,
                                   vjust = 1,
                                   margin = margin(b = half_line * 1.2),
                                   face = "bold", color = fb_colors["blue"]),
          panel.border = element_rect(fill = NA,
                                      colour = fb_colors["lightblue"]),
          strip.background = element_rect(fill = fb_colors["medblue"],
                                          colour = fb_colors["lightblue"]),
          strip.text = element_text(colour = fb_colors["white"],
                                    size = rel(0.8)),
          axis.text = element_text(size = rel(0.8),
                                   colour = fb_colors["darkblue"]),
          axis.ticks = element_line(colour = fb_colors["darkblue"])
  )
}
Using the Facebook Theme
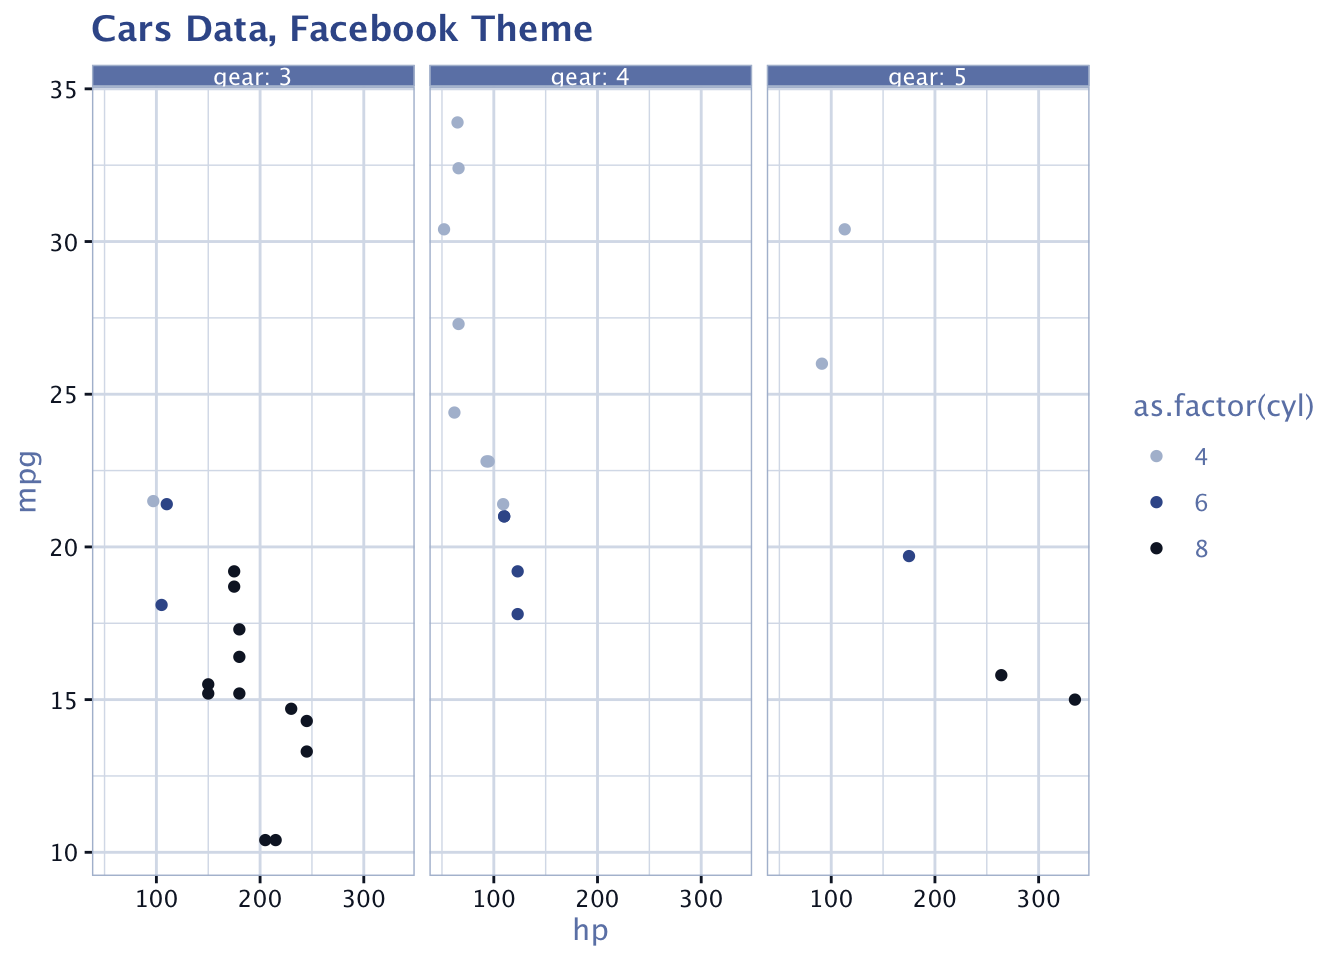
data("mtcars")

ggplot(data = mtcars, aes(x = hp, y = mpg)) +
  geom_point(aes(color = as.factor(cyl))) +
  facet_wrap(~gear, labeller = label_both) +
  labs(title = "Cars Data, Facebook Theme") +
  scale_color_fb() +
  theme_fb()
Sam Tyner-Monroe, Ph.D.
Managing Director, Responsible AI
I am an applied statistician and data scientist, with a wide range of skills and experiences. I’m passionate about using data to make a difference.