2022

2020
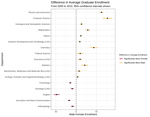
Visual complements to p-values
Talk given as part of a panel on commmunicating fitness for use.
Creating Beautiful Data Visualizations in R
A 2-hour virtual tutorial on data visualization in R with ggplot2.

Creating Beautiful Data Visualizations in R
A 2-day, 4-hour virtual tutorial on data visualization in R with ggplot2 given to Bureau of Labor Statistics and other federal employees.

Increasing Reproducibility and Efficiency with R
Introduction to the tidyverse and RMarkdown.

2019
What makes a good data visualization project? An applied statistician’s perspective
Talk presented as part of a topic contributed session.
Making your projects more reproducible and efficient with rmarkdown, tidyverse, and related R packages
Using the tidyverse and RMarkdown for your R analyses
The Uncoast Unconf: Who, What, When, Where, Why, and How? (not necessarily in that order)
What happened at the Uncoast Unconf?
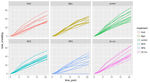
Graphics for the LAS Status of Women Report
Members of the graphics group re-creating visualization for the “Status of Women” report by the college.
2018
An interactive crash course in bookdown
Setting your thesis up for success with RMarkdown and bookdown.
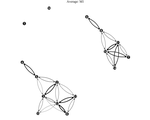
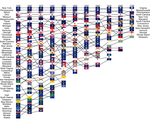
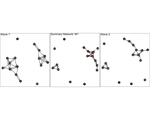
Model Visualization Techniques for a Social Network Model
Network Analysis, Text Mining and Bayesian Functional Clustering: Data Visualization and Other Considerations, Contributed Papers Section on Statistical Graphics
Lectures for the Research Experience for Undergraduates at CSAFE
Material for teaching statistics and R programming to the students in the summer REU program hosted by CSAFE. All students were science …
The Week of R
A week long R course covering data cleaning & manipulation, visualization, and writing Shiny apps.

Recreating Historical Graphics with ggplot2
Looking at graphics from W.E.B. DuBois and the statistical atlas of the United States.
2017
The Life-Changing Magic of Tidying Data
Cleaning data with the (modified) philosophy of Marie Kondo.
Network Model Visualization
Understanding complicated network models through visualization.
2015
The Joy of Clustering (with Bob Ross)
Presenting my paper as a finalist in Significance Magazine’s Young Statistician’s Writing Competition