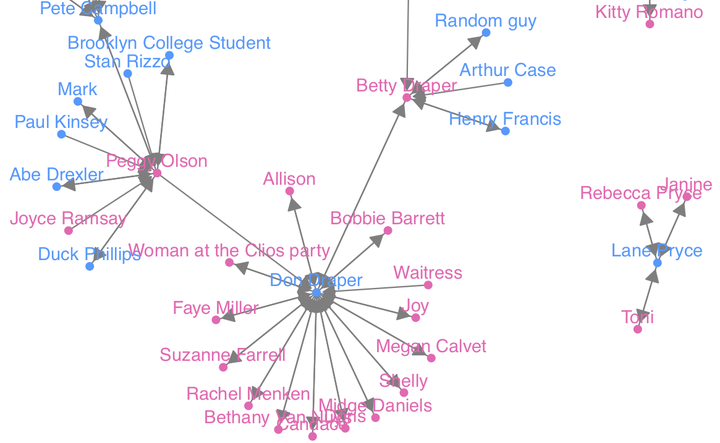
 Diagram of relationships in the TV show Mad Men drawn with the geomnet R package.
Abstract
This paper explores three different approaches to visualize networks by building on the grammar of graphics framework implemented in the ggplot2 package. The goal of each approach is to provide the user with the ability to apply the flexibility of ggplot2 to the visualization of network data, including through the mapping of network attributes to specific plot aesthetics. By incorporating networks in the ggplot2 framework, these approaches (1) allow users to enhance networks with additional information on edges and nodes, (2) give access to the strengths of ggplot2, such as layers and facets, and (3) convert network data objects to the more familiar data frames.
Type
Publication
The R Journal
More detail can easily be written here using Markdown.